Define a pricing model without data, research, or a budget
Pricing is hard, but it doesn't have to be a guess. Here I lay out five steps to defining a pricing model informed by data, with firsthand examples from my experience pricing two products: a SaaS offering and a consumer physical good.
Business Model
·
8 min
Don't just imagine "good" pricing for your product. Use data and be strategic… even when you don't have data or have yet to test.
Defining your pricing model (e.g., subscription, one-time) and price point is a key part of the business building process, and can make or break your product. But without data, a testing environment, and/or a research budget, it can be difficult to make informed and strategic pricing decisions. In this post I'll share a five-step process for being data-driven and smart about your pricing, by using the internet and publicly available sources. The only tool you'll need is an Excel/Google Sheet, and about ~4-6 hours in total, to get to a pricing model you can confidently take to market for any product.
Throughout this post I'll reference work from two companies I've co-founded: Forma (www.getforma.shop), a soon-to-launch service helping Shopify brands run customer research affordably; and Glimt (www.glimtlighting.com), a soon-to-launch Danish-inspired portable lighting company currently in manufacturing.
Build a database of similar pricing models
First step is to get as smart as you can on your market and the pricing models/levels of similar and competitive offerings. In most cases, this isn't data you can instantly find or download, so you have to get resourceful and build your own database to use as your knowledge base. It doesn't have to be a daunting task. The below story on pricing Forma took 4-6 hours.
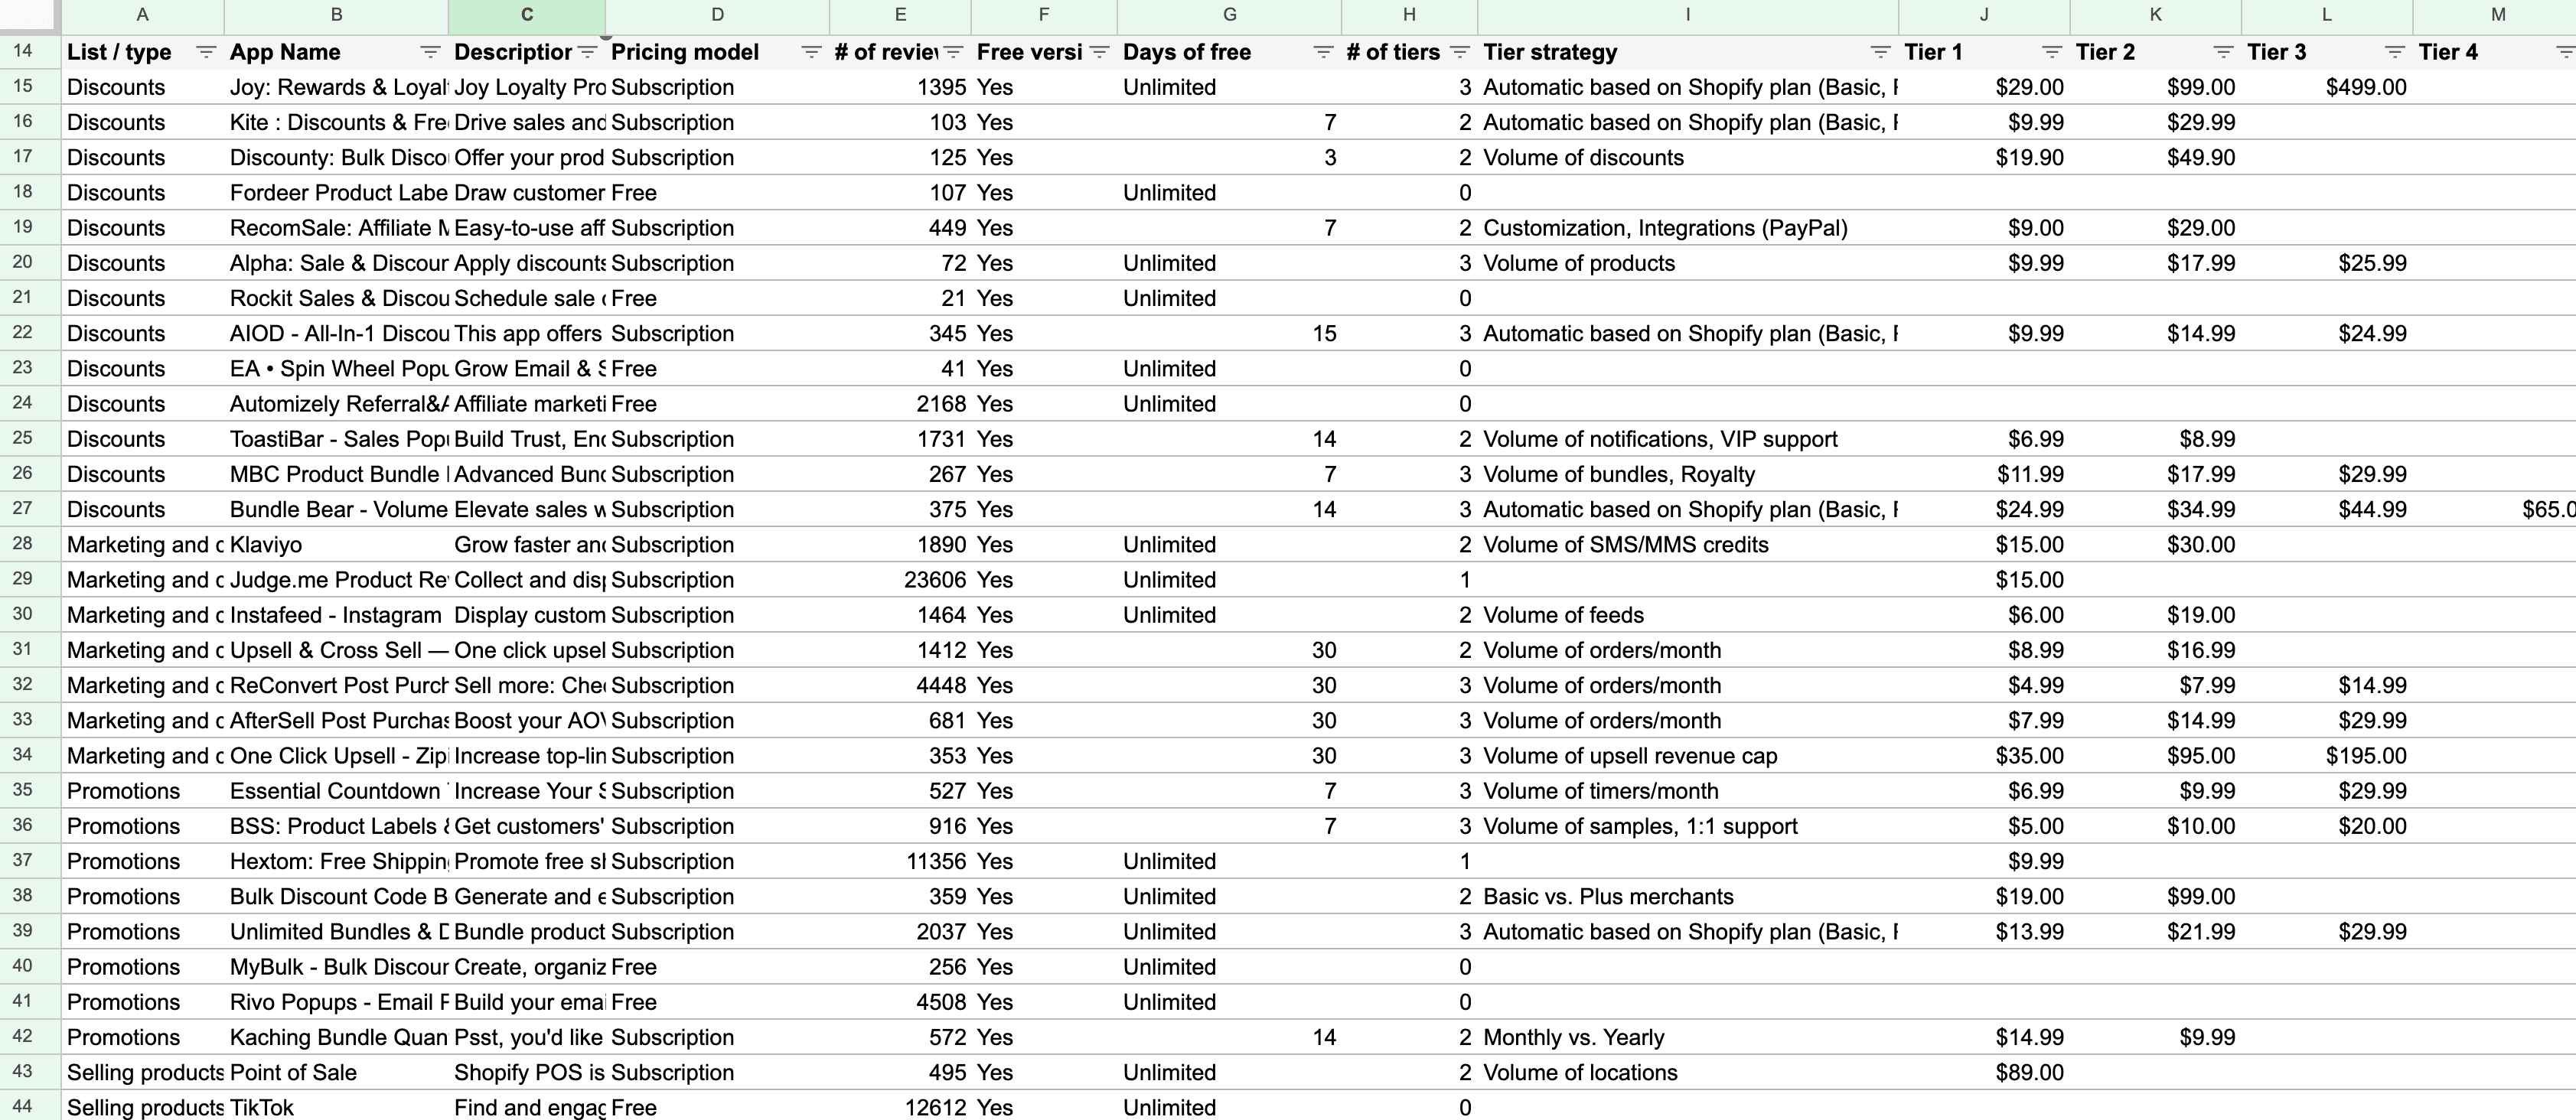
For Forma, our peers/competitors would be other Shopify apps — particularly those that charge some type of subscription based on different tiers. Since there is no Shopify pricing index, I built one in Google Sheets (See Image A below). As our source, we almost exclusively used the Shopify App Store website and App listings.
We manually catalogued a variety of datapoints for ~350 apps, which represented a significant enough sample for reliable benchmarking. You don't need to be overly-exhaustive, just collect enough data to have a directional understanding of the market's pricing models. Based on what we wanted to learn, we collected the following datapoints:
Type of app (e.g., Discounts, Promotions)
Name & description
Pricing model (i.e., subscription, free)
of reviews (so I could compare pricing from high vs. low reviewed apps)
Trial & length of trial
Tiers and the tiering strategy (e.g., volume of orders, premium service)
Tier pricing levels
Image A: Screenshot of the pricing database built for pricing Forma.

Find representative pricing to use as your benchmarks
Once you have a database and knowledge base that you feel is just exhaustive enough and representative, you can fairly easily find your benchmarks. Do some exploratory data analysis to uncover some insights… Some potential tactics could be to run a pivot table or simply use an average or median function to uncover findings and benchmarks.
For Forma, we were most interested in the following benchmarks from our data:
Subscription tiering strategy (i.e., what metrics differentiated tiers)
Standard length of a free trial
Typical number of pricing tiers
Median price of tiers (median to account for outliers that priced unusually high)
As you'll see in Image B below, we now had some really helpful benchmarks to inform our own pricing decisions. Based on entirely public market and competitor data. Specifically helpful benchmarks / findings for us were:
A tiering strategy based on volume of orders was the standard (66% of apps followed this model)
A free trial of 14 days / 2 weeks
Median tier pricing (for 3 tiers) would be ~$12, $21, and $30
Image B: General insights and benchmarks from analyzing our database

Set pricing scenarios based on benchmarks
Now that you're no longer making any guesses and have real data to work with, you can start inputting your benchmarks into some pricing scenarios…
For this part, we just created a new sheet in our Google Sheets file and built a table with the following (see Image C for reference):
Each tier as a row (in this scenario I had tested tiers)
Tier thresholds / Transaction volume (Side note I did some additional research to get transaction volume benchmarks for different sales segments of Shopify apps to understand potential user segmentation)
Price (heavily informed by benchmarks)
User segmentation & total addressable user base (here I used Shopify merchant stats and sales segmentation — more on this in the next chapter)
You can create multiple scenarios here if you want to test different models of tiers and pricing. Just duplicate the rows below with different models and prices.
Image C: Pricing model scenario to test using benchmarks

4. Plug in your TAM to test pricing scenarios
Whenever you estimate any value potential or project revenue on your pricing, you'll need two primary variables:
Value (i.e., how much your product will cost / your pricing)
Volume (i.e., how many customers might buy your product)
Our database essentially gave us Value, but you'll need to plug in your Volume. For this, I simply took statistics on Shopify merchants in the U.S. (from 2022), which I found from a reasonably credible source online. These are actually plugged into the pricing scenario table (in Image C above), and I broke down the specific number of addressable customers based on user segmentation, which was a slight assumption of which customers would fall into each tier. For this I used benchmarks of transactions per month for Shopify merchants, and tied that to my tiering model)
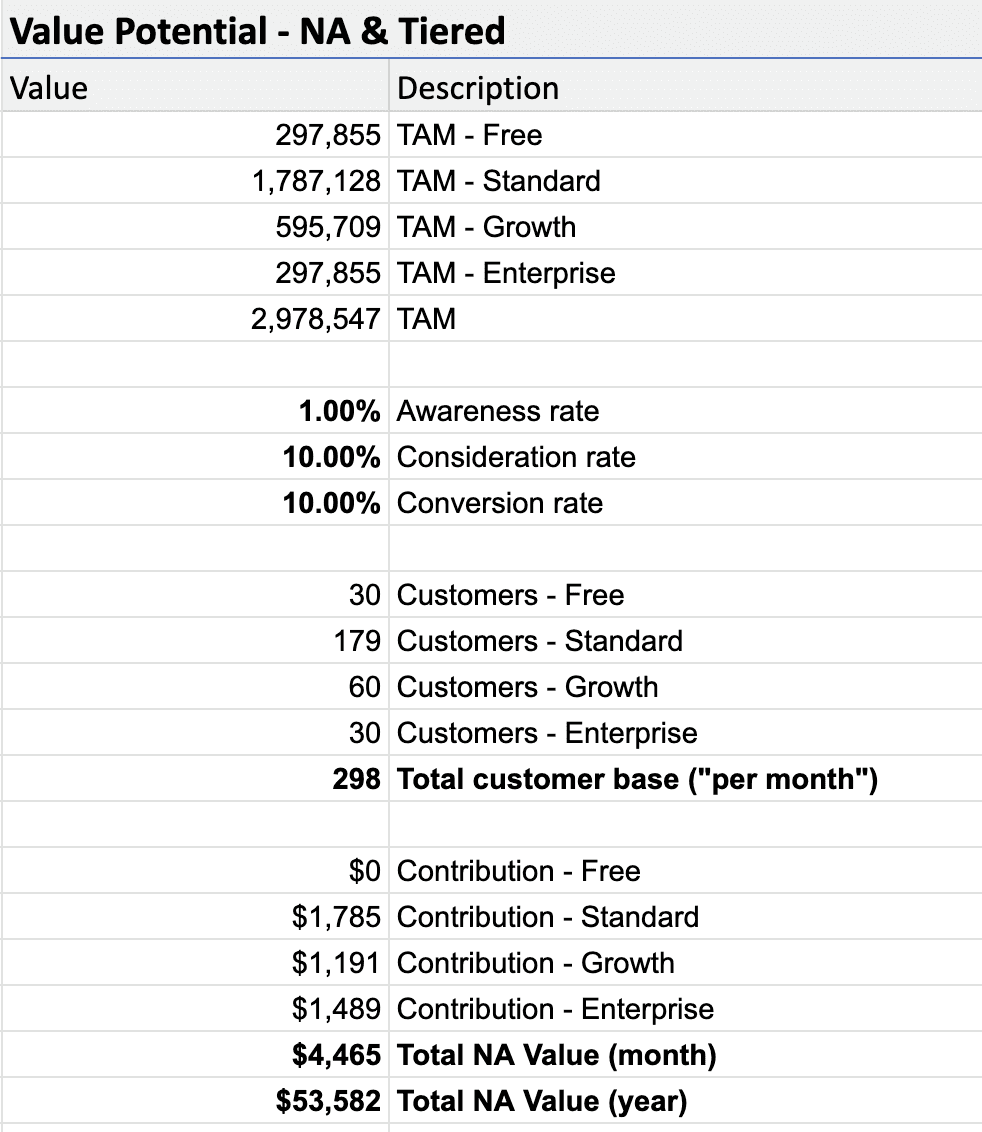
The goal of this part of the exercise is not to accurately estimate actual sales, but to understand relative performance across the pricing scenarios. So to get to some numbers to compare, I used the following conservative conversion assumptions (as seen in Image D below):
1% awareness rate (i.e., 1 of every 100 Shopify merchants will become aware of Forma)
10% consideration rate (i.e., 10 of every 100 aware merchants will consider trying Forma)
10% conversion rate (i.e., 10 of every 100 merchants that consider will actually try Forma)
Feel free to adjust your conversion assumptions. If this is not a new product for your business, you might also have some real numbers to use from your current conversion. The idea here is to hold this constant across your pricing to see what tiering model and pricing might work best.
If you'd like, you can make this more sophisticated by adding a recurring/annual view of:
Churn and retention assumptions per year
Market growth (i.e., new customers coming into the market each year)
Improved conversion assumptions after your brand is established
Image D: Very high-level performance of a pricing scenario

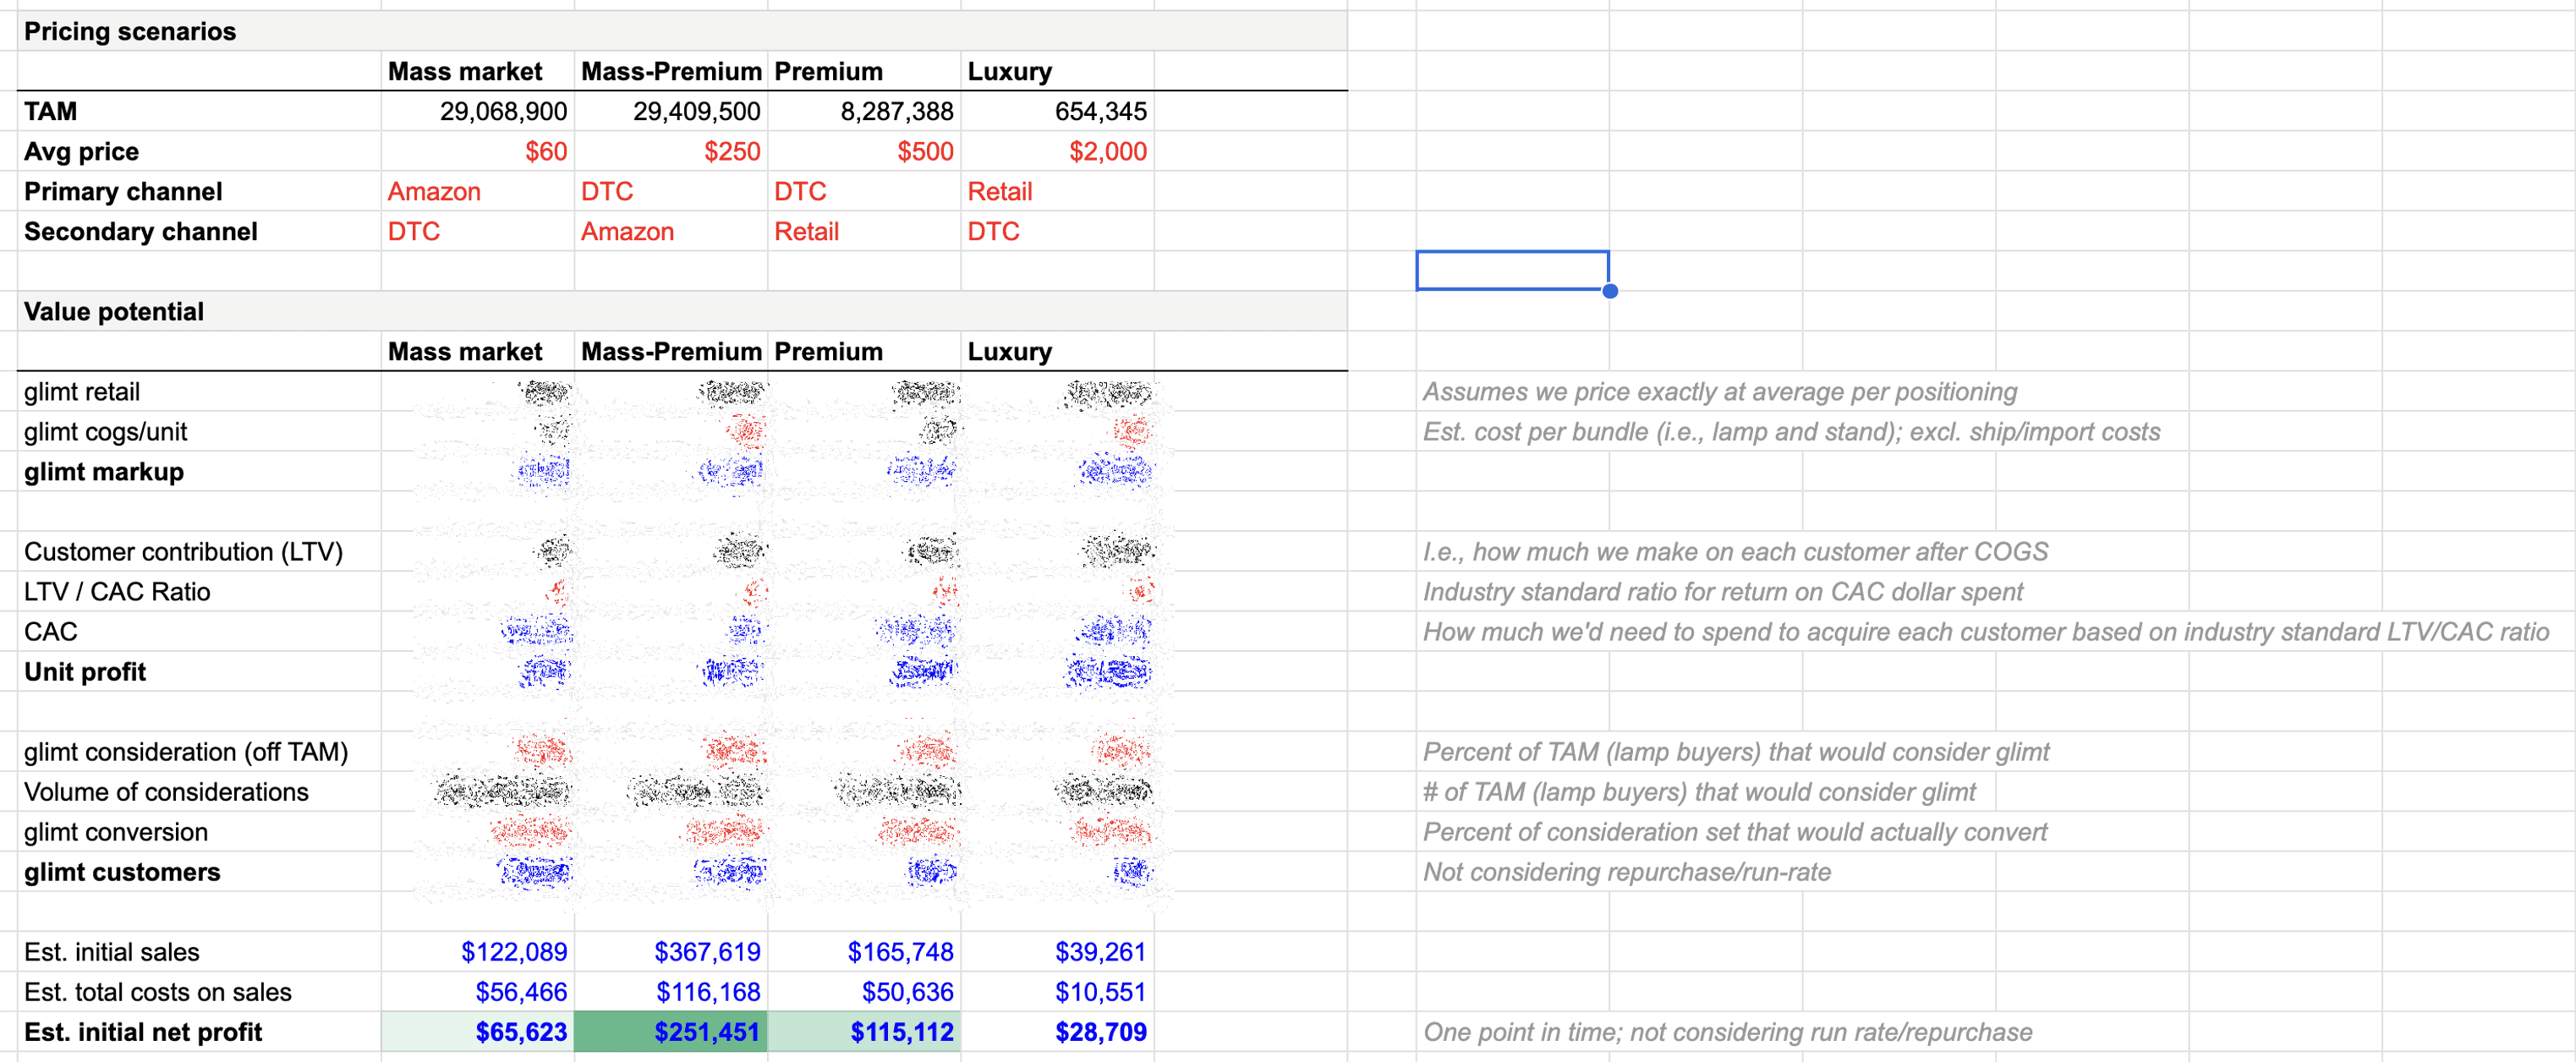
Image E: Another example of pricing scenarios for Glimt (DTC lighting company). Unit economics hidden.

Choose the best performing pricing
Once you run some pricing scenarios, you can evaluate and decide which is the best option to run with.
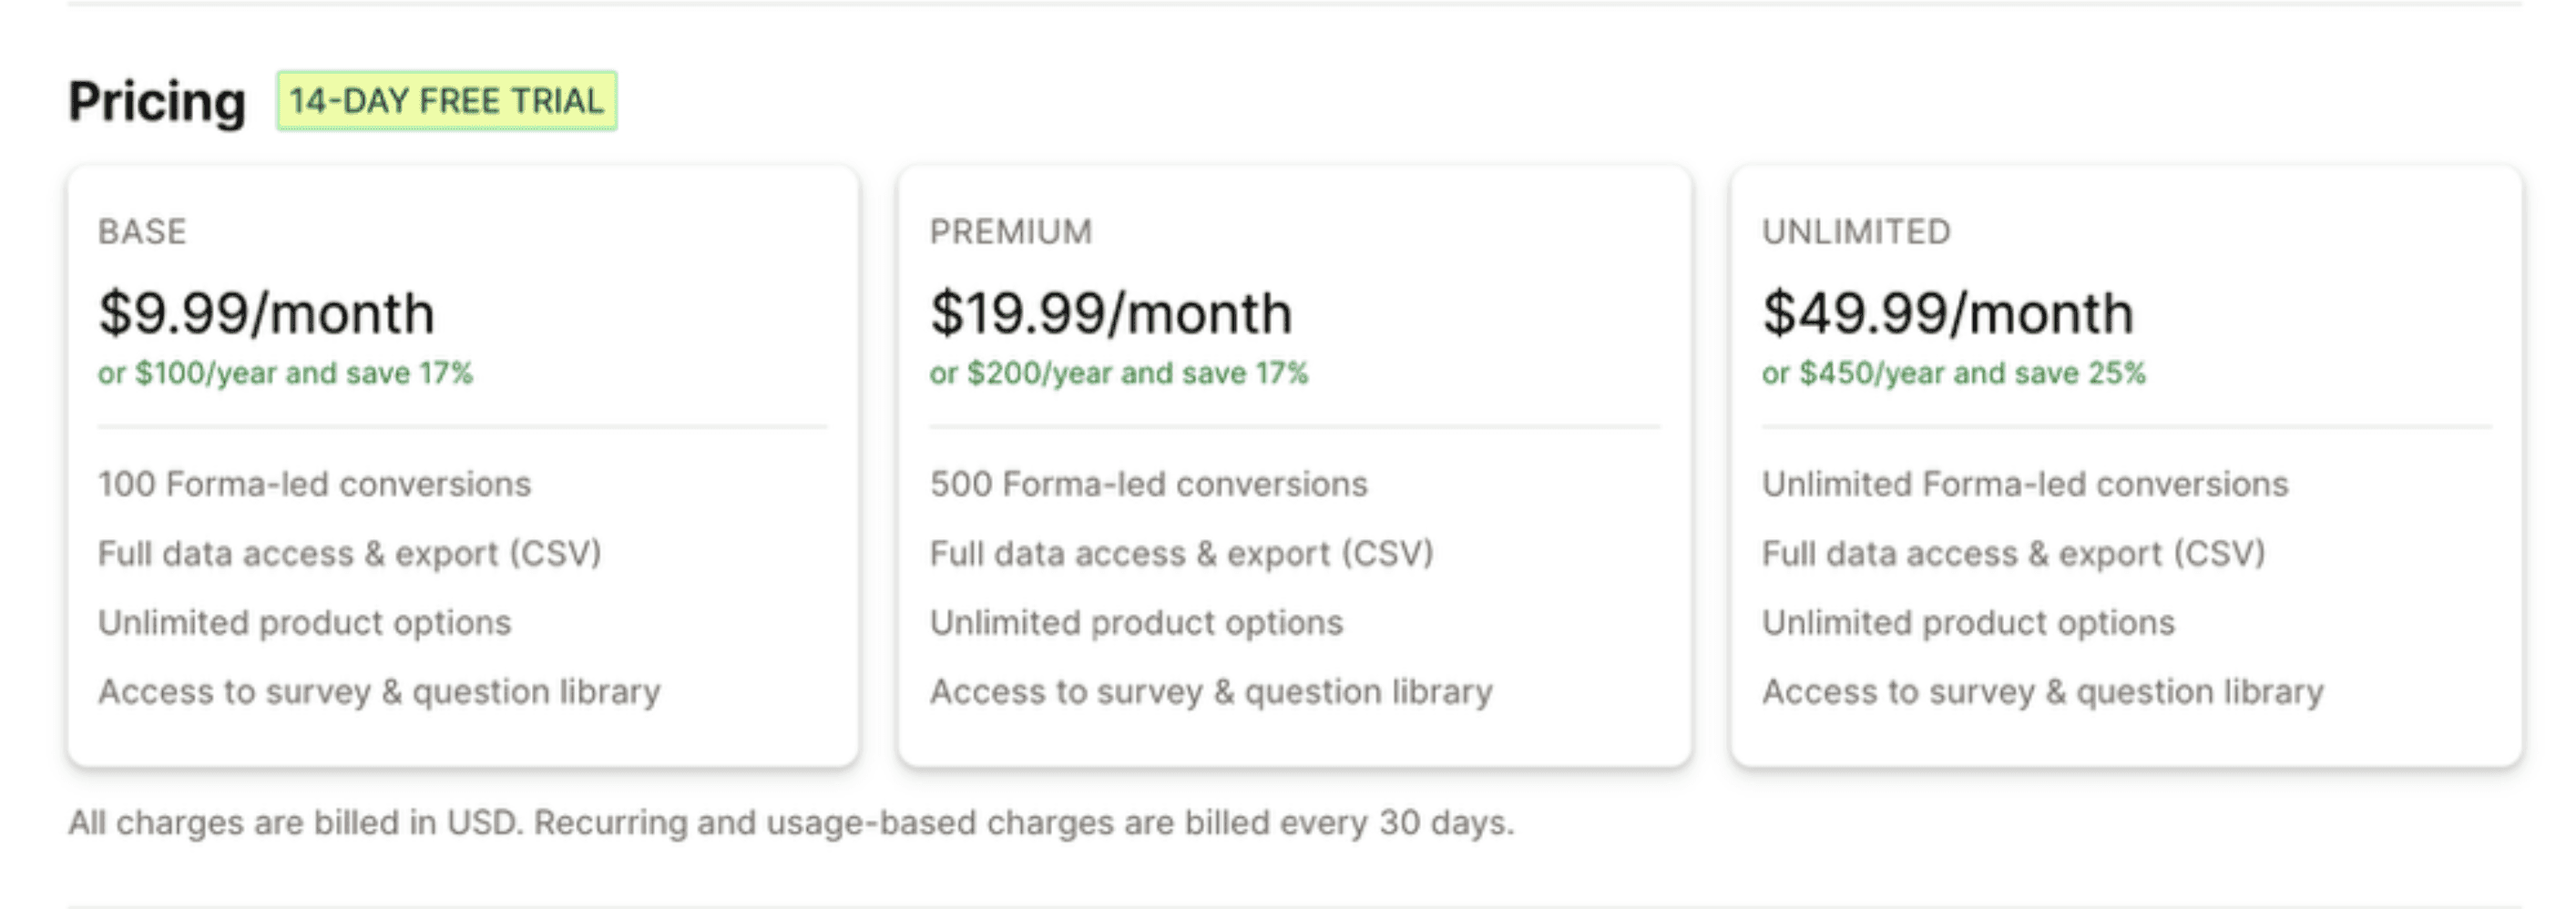
For Forma, we decided on the below (Image F), which is slightly under the median pricing for Base and Premium, and significantly higher than the median for the Unlimited option, since we've since refined the pricing scenario to target a small portion of Shopify merchants that fall into the top 5% of sales volume.
Image F: Pricing model shown on the Forma Shopify App Listing page

Test, learn, refine your pricing
As founders, you constantly need to make decisions with limited data without sinking too much time at each decision. Following these five steps should help you define an initial, data-informed pricing model for your product. Though you should continually test and refine your pricing. This could be through customer interviews, A/B testing of your pricing, impact on conversion, etc. Test, learn, and refine at every step to get to optimize your pricing model.